How to conduct a T-test to test statistical significance of average gift

So, you’ve just run a test to try to improve the average order size or average gift. Now you need to see if your results are statistically significant.
Here’s how you run a t-test in excel that will allow you to see if your difference in the average gift is statistically significant.
The Allegiance Group + Pursuant team members are experts in data analysis—let’s uncover key insights together!
First, you’ll need to install Excel’s data Analysis package.
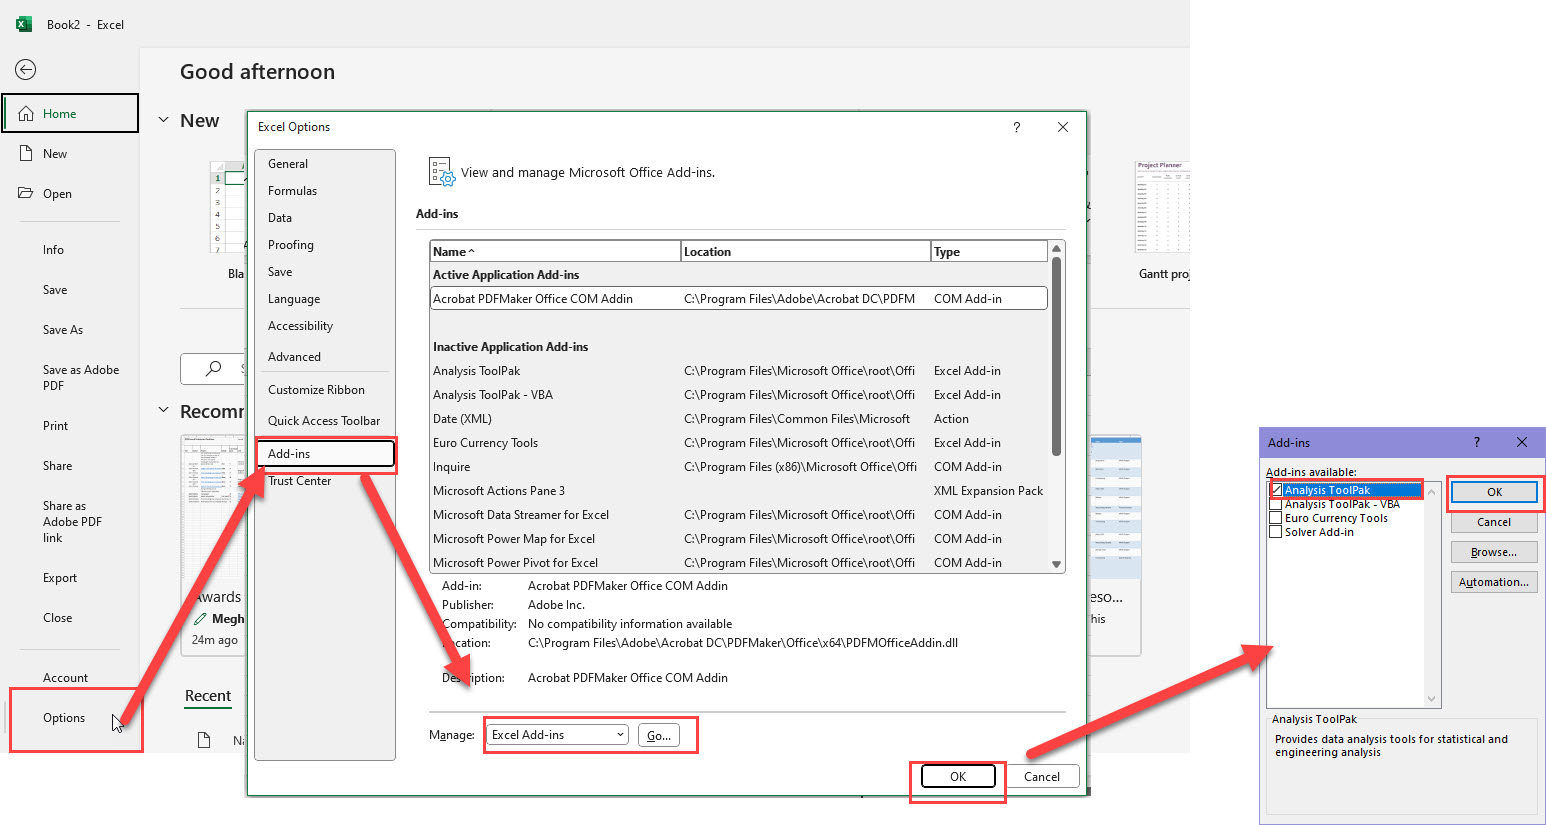
- Click the Microsoft Office Button, and then click Excel Options.
- Click Add-Ins, and then in the Manage box, select Excel Add-ins.
- Click Go.
- In the Add-Ins available box, select the Analysis ToolPak check box, and then click OK.
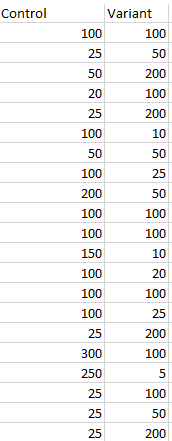
Create an Excel spreadsheet with two columns. The first column should contain the gift amounts from the control, and the second column should contain the gift amounts from the variant, as shown below.
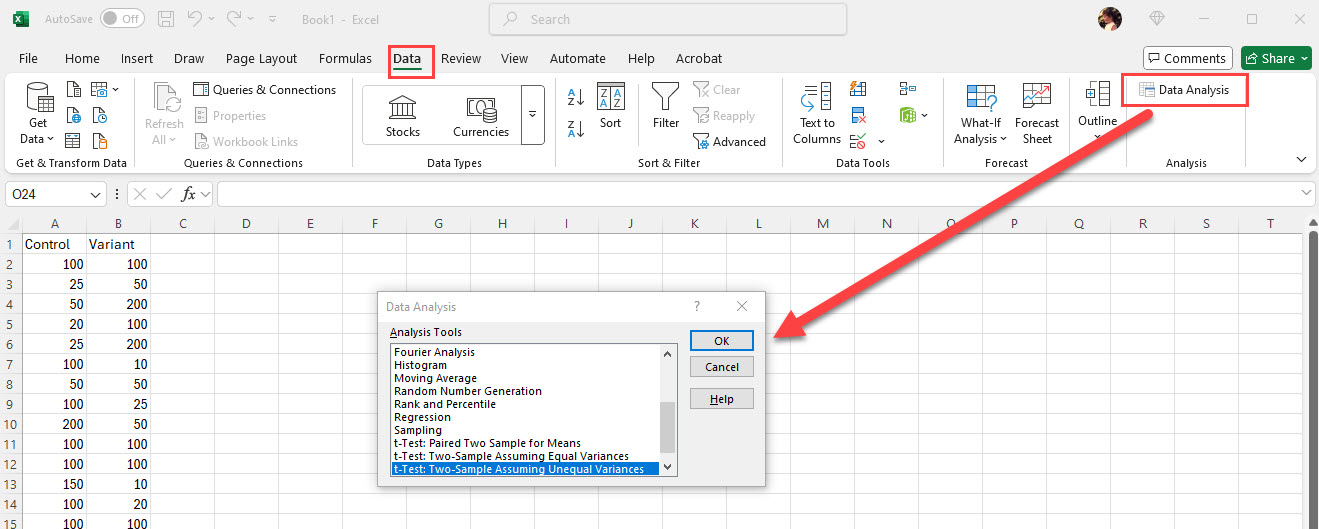
Under the Data tab, click on Data Analysis. Select the t-Test: Two-sample Assuming Unequal Variances.
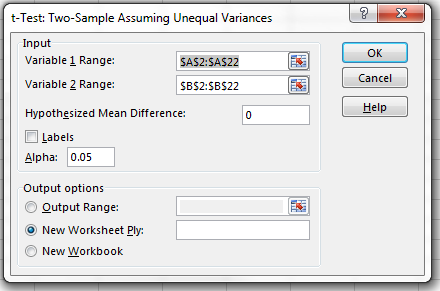
Select your data ranges for your two variables. Leave the Alpha unchanged at 0.05.
After a few seconds, Excel will display your results in a new tab.
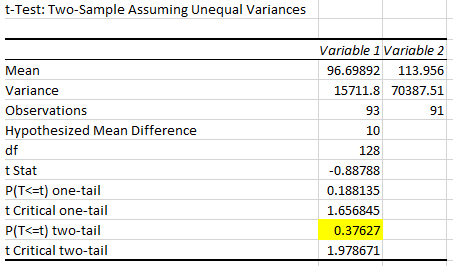
To interpret the results, you will want to look at the two-tail test because we want to understand if there is a difference in the means.
Because the p-value of the test is .37627 is greater than .05 (our stated p-value), we accept the null hypothesis, which is that there was no difference in the means.