How to Forecast Fundraising Revenue during the COVID-19 Recession

It’s another foggy morning. You take a sip of coffee while you gaze through your makeshift home office window. You see a street usually bustling with life that now sits eerily quiet and devoid of movement.
You turn on the news just in time to hear about a cascade of Fortune 500 CEOs withdrawing their financial guidance for the year. With a growing pit in your stomach, you wonder whether you should resist the urge to check your 401k balance.
Clarity on anything seems to be in short supply these days.
The phone rings, and you answer it. It’s your boss. They tell you the board needs new fundraising revenue projections by the end of the week, and you’ve been tasked to lead the project. That pit in your stomach has quickly returned. The request feels insurmountable, but you have no choice, so you agree.
Now what?
At a 2018 press conference, Jerome Powell explained his plan for leading the Federal Reserve through uncertain times. He said, “You’re walking through a room full of furniture, and the lights go off. What do you do? You slow down. You stop, probably, and feel your way.”
This is an uncomfortable situation that many people are now finding themselves in—having to feel their way through a dark room while trying to avoid making any mistakes. Creating revenue projections during a recession is challenging, but it’s not impossible if you utilize the right approach.
Creating Revenue Projections During a Recession
Many organizations rely on each department head to independently create revenue projections. Those projections are added together to create the organization’s revenue projection. This bottom-up approach often doesn’t verify that the final forecast aligns with the realities of the macroeconomic situation. There’s rarely coordination to ensure each department operates on the same assumptions.
There’s a quote from Takuan Soho that states, “Preoccupied with a single leaf, you won’t see the tree. Preoccupied with a single tree, you’ll miss the entire forest.”
I don’t believe Takuan Soho had revenue projections in mind when he said that, but the quote is still quite fitting for the situation. It’s best to begin projections by understanding the range of possible outcomes for the larger economy and then work down to the organizational level.
United States GDP Projections
Understanding the possible range of outcomes for the United States Gross Domestic Product (GDP) is essential because, according to a Stanford University study, charitable giving as a percentage of GDP has fluctuated within the relatively narrow range of 1.7% to 2.3% over the past 50 years. That means you can use GDP projections to help you understand the possible range of overall charitable giving.
Unless you’re an economist, I don’t recommend creating your own GDP projections. Instead, use GDP projections based on estimates from reputable experts. The list below includes GDP projections for 11 well-known institutions:
|
United States 2020 GDP Predictions | ||
| Organization/Source | GDP Prediction | Prediction Date |
|---|---|---|
| Congressional Budget Office | -5.60% | 4/24/2020 |
| Moody’s Analytics Avg. | -4.90% | 4/20/2020 |
| Allianz/Mohamed El-Erian | -10% to -14% | 4/20/2020 |
| International Monetary Fund | -5.90% | 4/14/2020 |
| The Conference Board | -3.6% to -7.4% | 4/9/2020 |
| PIMCO | -5.00% | 4/8/2020 |
| Kiplinger | -4.00% | 4/7/2020 |
| Fitch Ratings | -3.30% | 4/2/2020 |
| Goldman Sachs | -6.20% | 3/31/2020 |
| Deloitte Insights | -8.3% to -15.6% | 3/27/2020 |
It might seem like the two estimates that are below -10% are simply outliers and, as such, can be dismissed. Interestingly, most other projections assume a quick end to the pandemic, leading to a strong 3rd and 4th quarter rebound in GDP. Those overly optimistic viewpoints contrast with healthcare professionals’ advice and expectations. In short, to create a realistic view of the true best-case and worst-case scenarios, always include the larger expected drops in GDP.
That means the range of outcomes for GDP based on the most optimistic high-end and the most pessimistic low-end would be -2.9% to -15.6%, using the listed resources.
Speaking of ranges, a common mistake people make with projections is creating a single expected outcome. Unless you’re omniscient, you won’t be able to predict the future with 100% accuracy. Projecting a range of outcomes even when times are good is highly recommended. Creating a best-case and worst-case scenario will force you to uncover potential pitfalls and evaluate the possible impact those pitfalls could have on your results.
Nonprofit Industry Projections
Giving as a percent of GDP was 2.1% in 2018. The 2019 numbers have not yet been published, leading to one of the first significant assumptions we’ll be making: the 2019 giving level will be 2.15%. The assumption is based on the fact that outside of the great recession and immediately afterward, giving as a percentage of GDP over the past 20 years has been in an even narrower range from 2.0% to 2.3%.
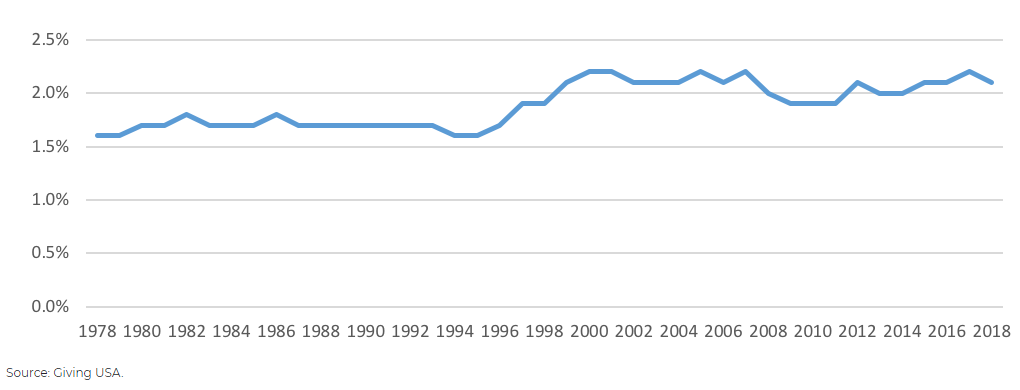
Since the current recession began after the end of 2019, we are using the midpoint of that 2.0% to 2.3% range as our baseline estimate. Those assumptions would potentially change year-over-year charitable giving revenue between 3.87% and -33.27%.
| US Charitable Giving Estimates (In Billions) | ||
| US Charitable Giving Estimates (In Billions) | |||
| High | Low | ||
|---|---|---|---|
| 2019 GDP | $21,430 | $21,430 | |
| 2019 Giving Percentage | 2.15% | 2.15% | |
| 2019 Charitable Revenue | $461 | $461 | |
| 2020 Change in GDP | -2.9% | -15.6% | |
| 2020 GDP | $20,809 | $18,087 | |
| 2020 Giving Percentage | 2.3% | 1.7% | |
| 2020 Charitable Revenue | $479 | $307 | |
| Change in Charitable Revenue | 3.87% | -33.27% |
Nonprofit Sector Projections
Not all nonprofit sectors will experience the same impact on revenue. Food banks, for example, actually realized increased donation revenue throughout the Great Recession while charitable giving decreased by 10.9%.
Review all available data to determine how past recessions impacted your organization’s revenue. Was it larger or smaller than the national average? Make sure to reach out to your peers, partners, associations, and competitors within your nonprofit sector to see if they’d be willing to share insights regarding revenue impacts from previous recessions.
The goal is to understand better how your specific nonprofit sector is impacted during recessions compared to the national average and then adjust the 3.87% to -33.27% range accordingly.
Nonprofit Organization Projections
This is where the department and channel-specific projections come into play. For example, let’s assume your nonprofit sector experiences the average industry decline during a recession. That allows you to leave the overall range from 3.87% to -33.27%. You are then told your media budget will need to decrease by 20% in 2020 to help reduce expenses. All things being equal, a 20% reduction will likely result in an additional layer of negative revenue impact. You will need to factor the media-specific revenue reduction into overall projections by reducing both your top-range and bottom-range estimates.
Determining how organizational decisions like those will impact your estimated ranges will require input from your department leads. Remember to be upfront and share all assumptions used to date to ensure everyone is on the same page before departments begin their projections.
Presenting Projections
You’ve finished your research, crunched the numbers, and are ready to show off the results. So, how should you report your findings?
Stay Data Dependent
Avoid using “gut instincts” when reporting your revenue projections. Do your best to have supporting data and sources for all major line items.
Clearly State Your Assumptions
Stating your assumptions helps people understand the logic and data used at the foundation of your projections. It allows people to discuss your assumptions and ultimately come to a consensus. Having upfront group consensus about the assumptions should also help provide you with an extra shield of protection in case any assumptions turn out incorrect.
Displaying a Range of Possibilities
The Bank of England coined the term “fan chart” for a chart they began using to display uncertainty in their August 1997 Inflation Report.
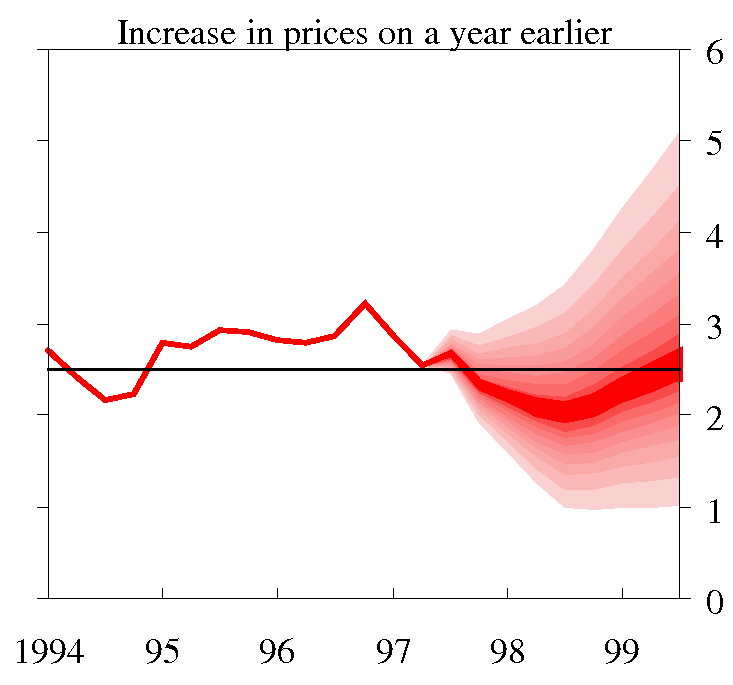
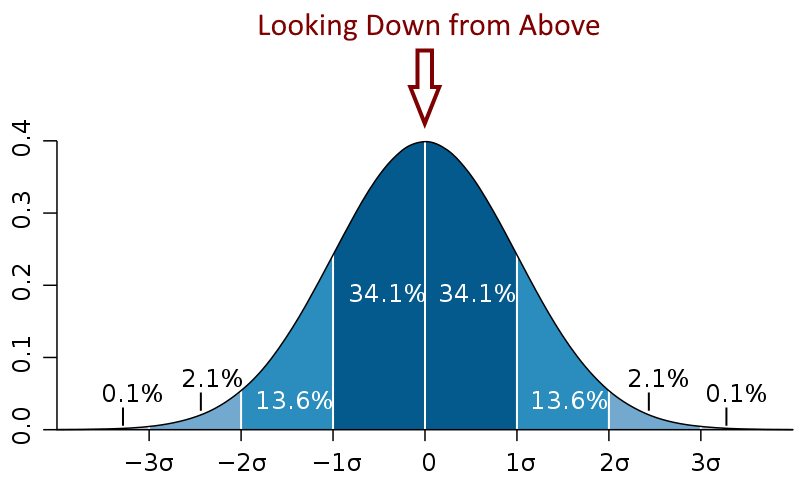
The resulting fan chart displays the range of potential outcomes. The section of the chart colored dark red represents the outcome with the highest probability of occurring. As the shade of red becomes lighter, the chance decreases. In other words, the chart illustrates an overhead view of a probability distribution curve as it changes through time.
A fan chart’s range of possible outcomes increases over time because uncertainty is a compounding factor. That’s what gives the chart its fan shape. The fan’s overall width also helps display the depth of uncertainty for a given situation.
Today’s level of uncertainty is at an extreme level based on historical standards. Any realistic revenue projection should have a significantly wider range of possible outcomes than during an average year.
The good news is that fan charts can be created and customized using Excel. The fan chart below, created using Excel, displays revenue projections we made for a client last year.
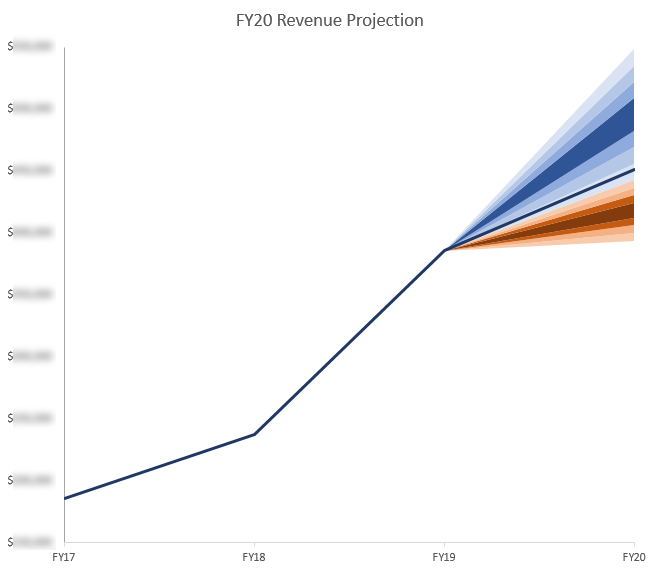
Based on the economic conditions in 2019, we believed there was a higher probability of a recession in 2020 than in average years. For that reason, we created a range of projected outcomes that included projections for a year without a recession (blue) and a different range of projected outcomes for a year with a recession (orange.)
Now that we’re closing in on their fiscal year-end, we updated the chart to show how much revenue was raised compared to the original projections. The dark blue line represents the actual revenue raised. Luckily, a recession did, in fact, strike at the beginning of 2020, after we had finished a strong EOY giving season. Since the recession impacted only part of their non-EOY fiscal year, the result was that revenue landed just above the threshold where our regular projections transitioned into recession projections. Given the situation, this result is almost exactly what we would expect, highlighting that it’s possible to create accurate forecasts during uncertain times.
Here’s a tutorial for how to create a fan chart using Excel: peltiertech.com/excel-fan-chart-showing-uncertainty-in-projections
Hope for the Best, but Prepare for the Worst
There’s nothing wrong with being optimistic, but if you want to be optimistic, do it in your high-end revenue projections. People usually get into trouble by being too optimistic with their low-end revenue projections. Always reserve the low-end projections for what to expect if everything goes wrong.
I often have clients tell me they’re required to submit a single revenue projection for budgeting purposes. In that case, I will usually recommend taking the conservative approach, which uses the low-end revenue projection as the baseline, especially for any organization that will experience significant negative impacts if they over-project monthly cash flow. It’s also a helpful practice for setting realistic goals and expectations during periods of high uncertainty.
As the year unfolds, an unexpected situation may impact your original assumptions. Or maybe your assumptions hold true, but an unaccounted-for variable leads to broken calculations. Those scenarios will likely be pretty standard in the year or two to come.
The most important thing is not to panic. Take a deep breath, and realize it’s going to be ok. Then, flag the issue to the appropriate people, make the necessary adjustments, and learn from the situation so that you can create even better projections down the road.
If you need help re-projecting your fundraising revenue, we’d be happy to assist. Contact us.