
“Numbers have an important story to tell. They rely on you to give them a clear and convincing voice.”
— Stephen Few, data visualization expert
On a single day, Facebook users share 2.45 billion pieces of content — and that’s on just one platform. Add in news sites, cat videos, promo emails, memes, and podcasts, and you quickly understand why organizations struggle to attract attention. The competition for eyeballs is fierce, but data visualization offers a way to stand out.
Data visualization uses graphs, maps, and other graphics to communicate complex information more effectively. Why is data visualization so effective? People are better at recalling information from images than text. According to John Medina, author of Brain Rules, we retain 10% of its information three days after reading text. But pair that text with an image, and we remember 65% of the information communicated.
That’s a big jump. Imagine the impact your nonprofit could have if audiences better recalled its stories and messages or made better use of your organization’s tools and services.
That possibility became a reality for AARP’s Public Policy team when we partnered together to improve a digital tool its constituents use to inform long-term services and supports (LTSS). We designed a website using data visualization to communicate the results of LTSS policies in states in a way that’s easier to understand and remember.
- The Problem: A Heavy Cognitive Load
- Towards a Solution: User Research
- Designing Charts and Color to Communicate Quickly
- A Deeper Dive: Intuitive Interaction Design
- Iterate and Interpret
- A Simple and Easy Back-end
- Next Steps: Developing a Data Visualization Project
The Problem: A Heavy Cognitive Load
Policymakers, one of AARP’s audiences, plan for long-term services and supports (LTSS) to help people age independently in their communities. (Think adult day care, Meals on Wheels, or transportation to and from appointments.)
AARP helps policymakers by providing a digital scorecard that measures how states nationwide perform across different categories, such as nursing home costs or long-term care insurance. Policymakers use the scorecard to see how their LTSS programs compare to other states and to determine where and why they might allocate resources more effectively.
To produce the scorecard, AARP pulls and analyzes information from large state and federal data sets. Before the redesign, the results were presented in a text-heavy format.
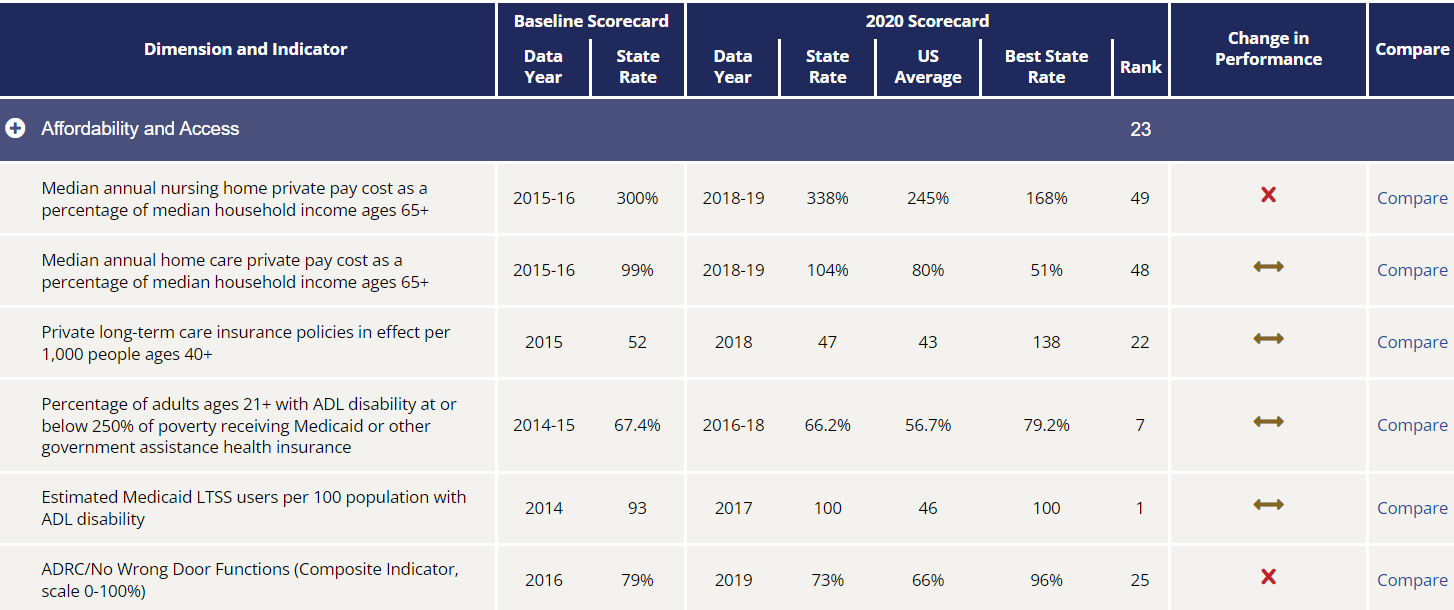
The old data presentation required a lot of cognitive processing, obscuring the story, or the point, behind the numbers and text. To excavate it, we developed a story framework structured around a hook, the conflict, and its resolution.
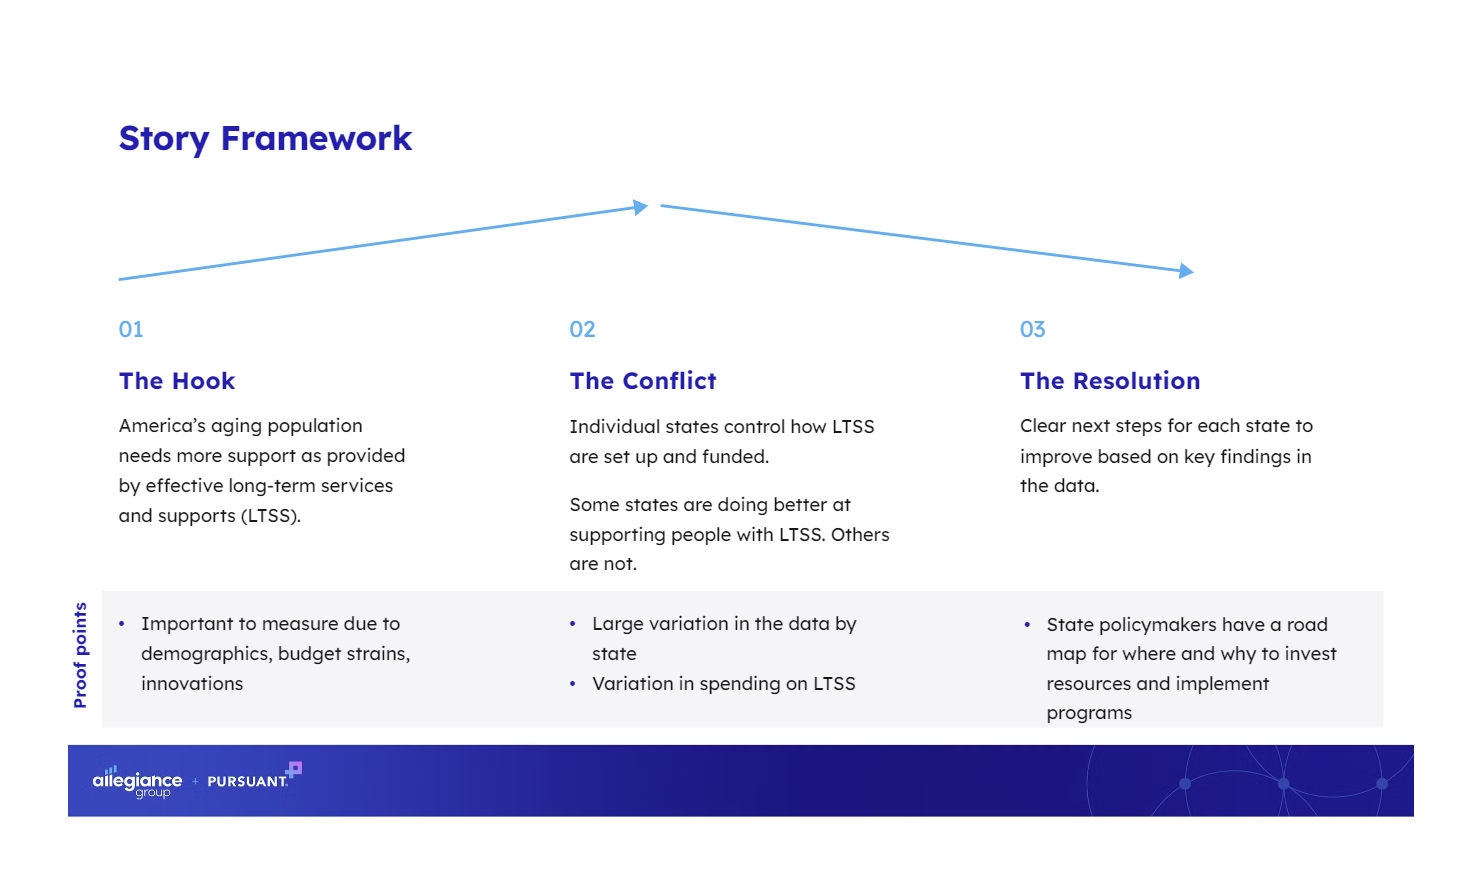
Could the story framework help us reimagine the text-heavy scorecard into compelling data visualization?
Towards a Solution: User Research
To understand how the Scorecard could better resonate with users, AARP took a step familiar to the best content creators: audience research. AARP conducted focus groups that included users already knowledgeable about LTSS issues and affiliated data and trends, as well as users who had no connection to LTSS or related concepts.
The feedback was illuminating. The scorecard was “really dense,” said one participant. “It looks like it’s meant for researchers. It’s not broken up . . . or readable.” Another found the information helpful, “but if I’m just looking for something really quickly, my eyes are sort of glossing over . . . it’s a lot of numbers.” Participants also wanted the dashboard to be mobile-friendly and easier to use on a laptop.
The input pointed to a guiding principle of data visualization: Keep it simple.
Designing Charts and Color to Communicate Quickly
How do you simplify a text- and data-heavy scorecard while still accurately and quickly conveying the complex information policy-makers seek?
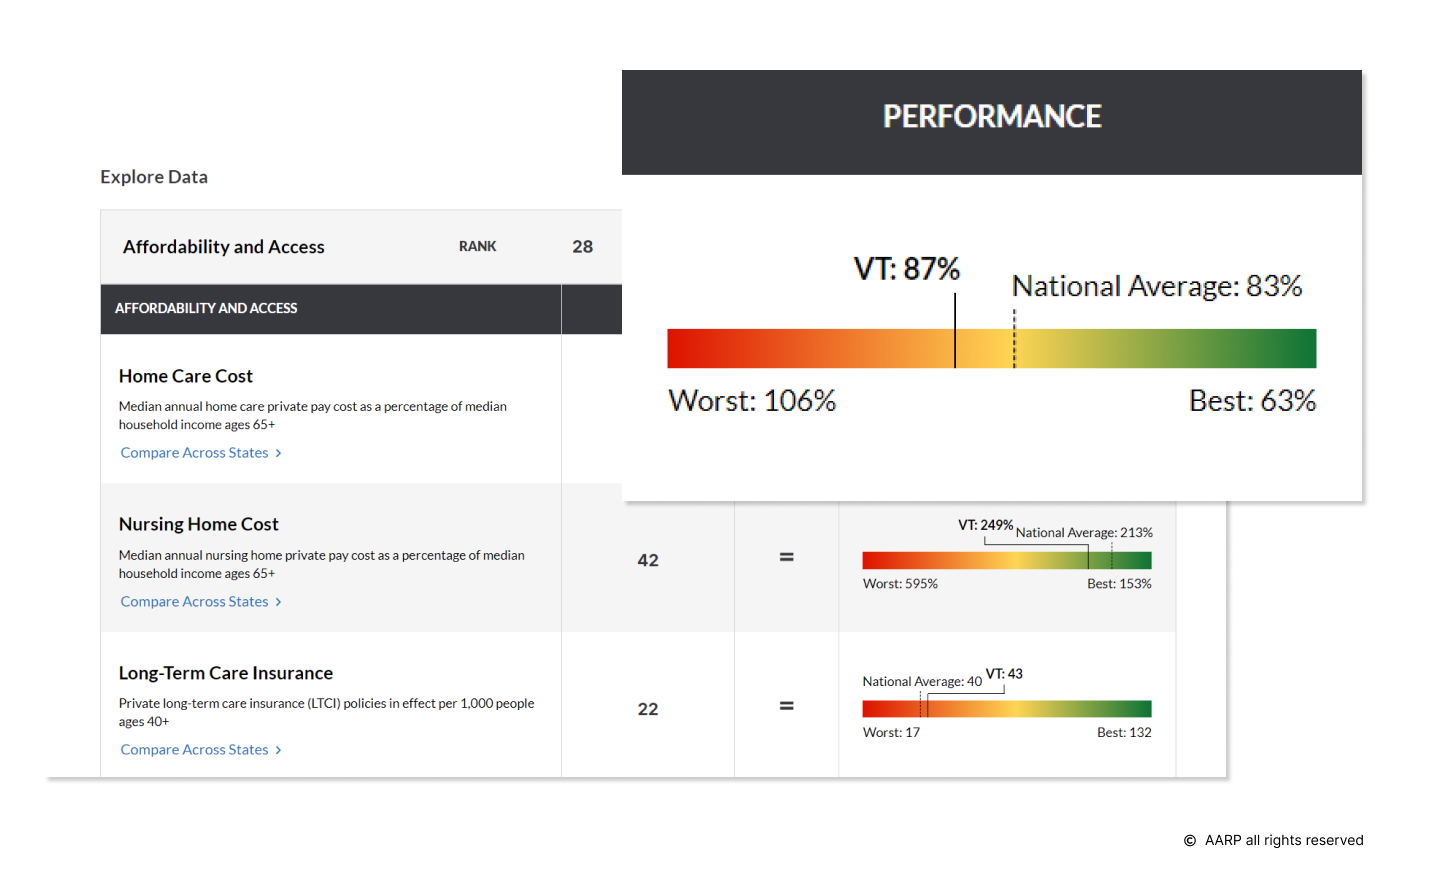
AARP’s data set presented an interesting information design challenge: the numbers and percentages for the various metrics didn’t use a consistent scale. A high number on one metric could mean poor performance. A high number on another metric, however, could be cause for celebration.
We knew the value of the website wasn’t providing the number, but providing the interpretation, in the analysis, of that number. Is that number good? Bad? How does that number compare to other states? Our goal for the new AARP LTSS Scorecard website was to design a chart anyone could look at and understand immediately how a state was doing.
So, we designed a bar chart using red and green to indicate “good” or “bad” to alleviate the confusion. A number could be high or low, but where it sat on the bar chart — closer to green or nearer to red, for instance — quickly told users how to understand it.
However, roughly 8% of people are red-green color blind. To make the bar chart accessible, we added text labels below the chart explaining which side was worst and best.
A Deeper Dive: Intuitive Interaction Design
While the scorecard gave users swift access to information, we heard during the focus groups that some users wanted the ability to dig deeper into the data.
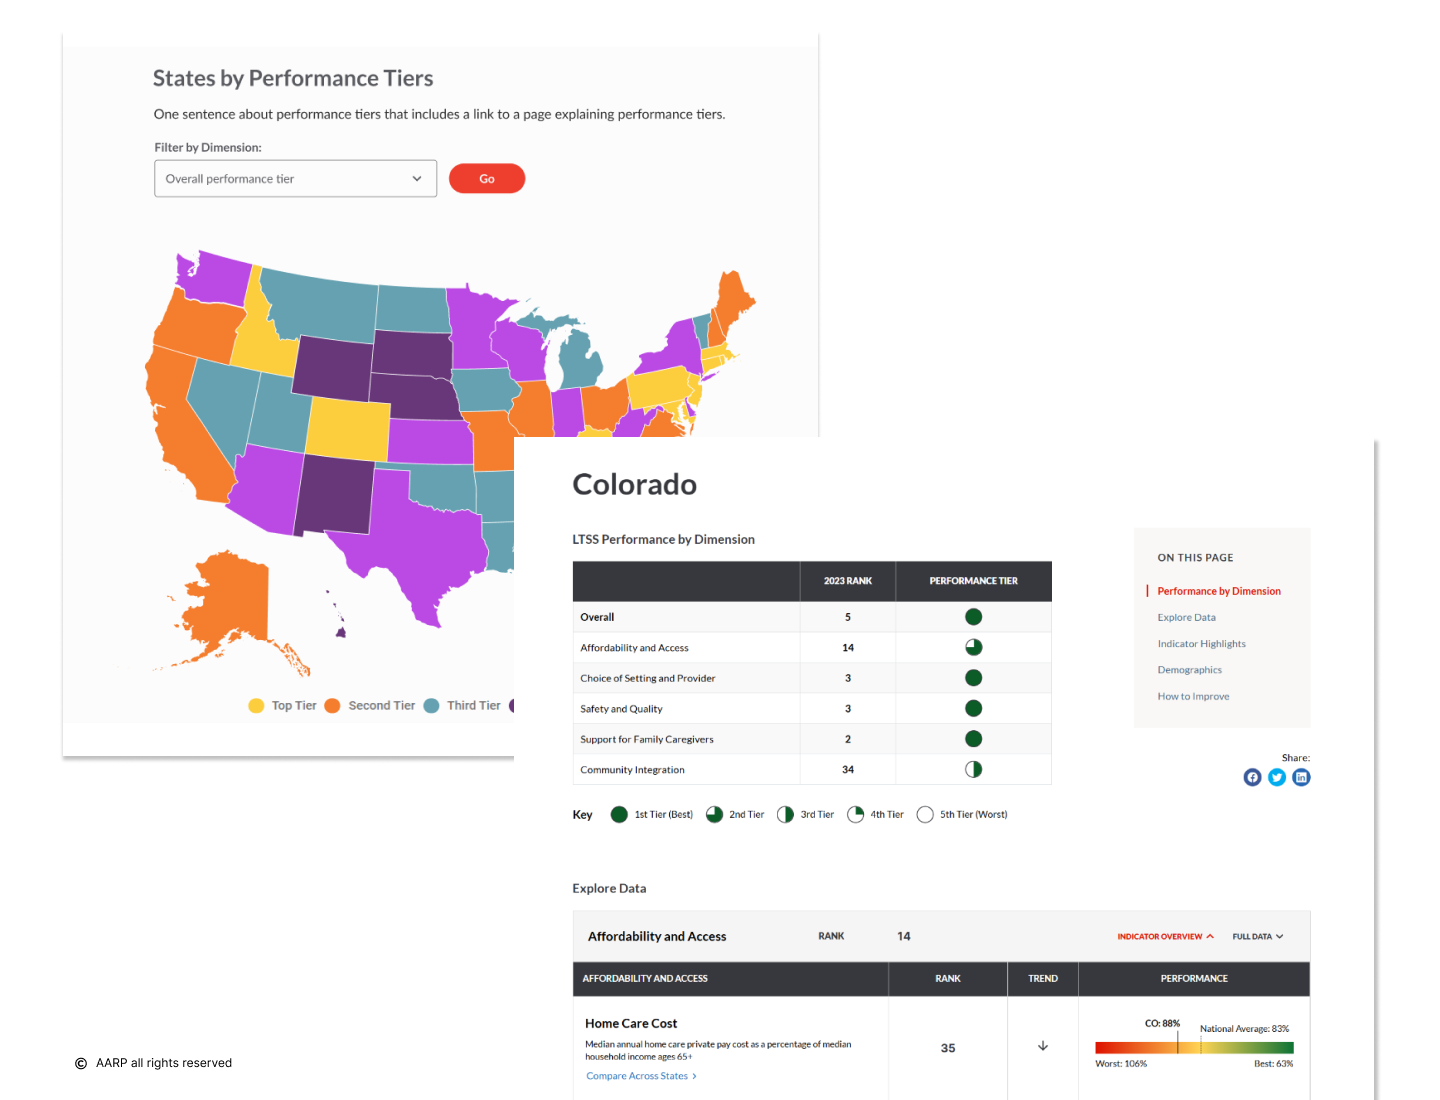
So, we designed an experience that starts with high-level results and lets users click into data to see more specifics. Users can see state-specific data, compare states on different metrics, and see the full chart of all the data. We designed intuitive interactions to allow users to dig into the data.
For example, for users who want to compare the LTSS programs with other states, we built a clickable map that shows all the states and their performance tiers. Users can click on any state to get state-specific data on specific LTSS metrics.
Iterate and Interpret
You never really know how people are going to interpret things, though. To see if our data visualization efforts were hitting the mark, we went back to the same focus groups, gathered more feedback, and adjusted the design.
A Simple and Easy Back-end
The back-end administration of the new site allowed AARP to easily update the data powering the narrative. AARP can easily add new stories and graphics. “But, most importantly,” said Julie Alexis, Vice President of Strategic Initiatives at AARP, “[we can] take the data and use it to refine the story, update the story in a way that’s going to continue to create a lot of value not just for state offices but also the policymakers who really do use this roadmap as a key tool in their decision-making.”
Before the redesign, AARP had to design and build each scorecard from scratch, but now, the nonprofit is more nimble and can adjust the scorecard and related elements more quickly.
Next Steps: Developing a Data Visualization Project
A data visualization approach can transform a nonprofit’s offerings and further fuel its mission. Keep the suggestions outlined above in mind as you consider how you might incorporate data visualization in your storytelling. Remember, different types of data require different visualization techniques — bar charts for comparisons or line charts for trends. The more you understand your data, the more you’ll ensure that the right visualization technique is used.
Not sure what data visualization technique to use?
Download our data visualization cheat sheet to learn about the most common data visualization types, use cases, and applications for nonprofits.
And reach out to our UX/UI team – we love a data viz challenge!
About TJ Peeler

TJ is the Director of User Experience at Allegiance Group + Pursuant. She has been creating digital experiences that get the right content to the right user at the right time for over 15 years. She has worked with clients such as League of Women Voters, American Physical Therapy Association, Mass Audubon, and American Forests.
TJ’s areas of focus include data-driven content strategy, content design, digital strategy, user research, user engagement, workshop facilitation, wireframes, and information architecture.